Use-case: Remote study
Collect data from participants taking part in a remote study with a self-created, online prototype.
CONTEXT
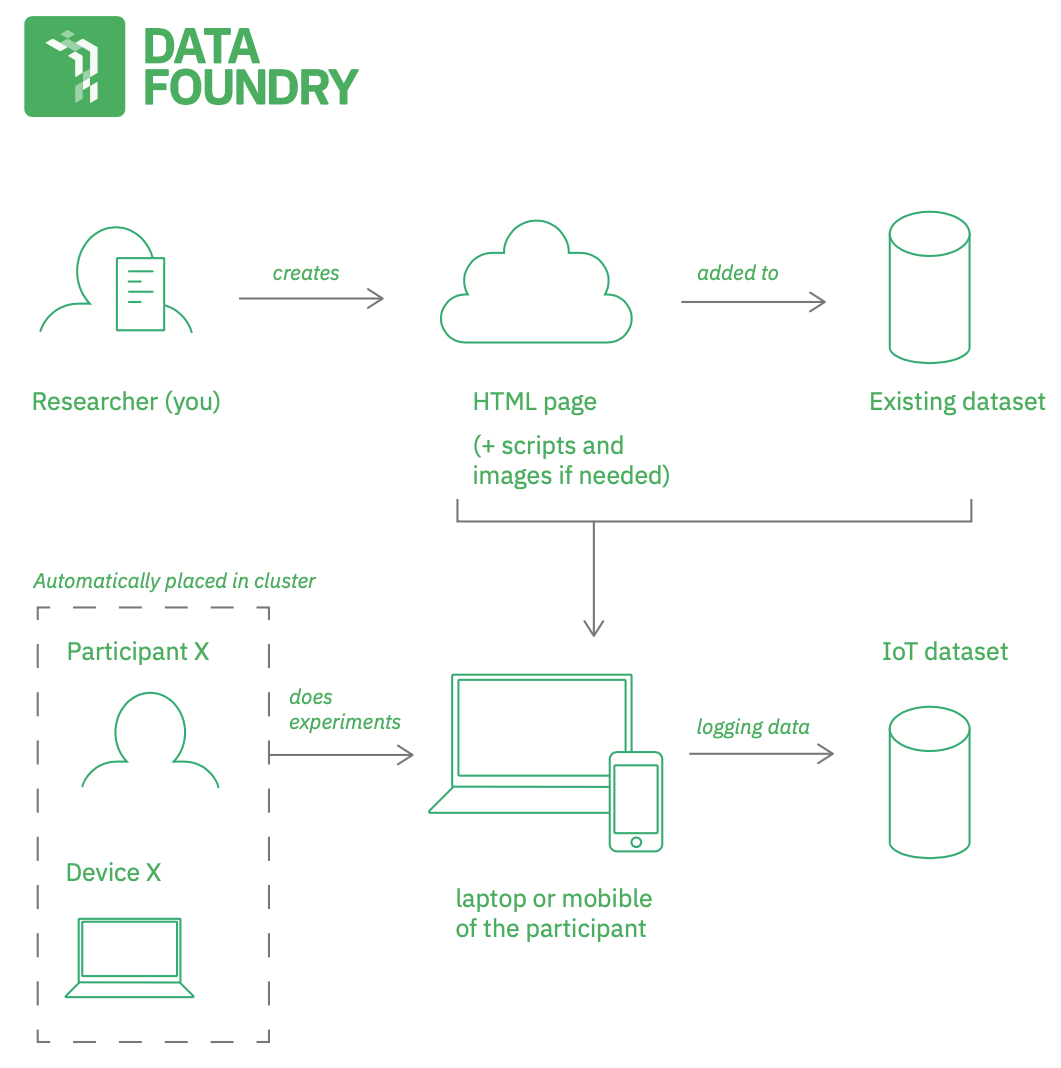
If you want to do digital experiments remotely, Data Foundry offers possibilities to do that with registered participants and the use of an Existing dataset. You can upload a web-based prototype to the Existing dataset as one or more HTML files (index.html, ...) and images or script if you need them. Data Foundry will host this prototype for you and allow to collect data from participants that interact with the digital prototype. This use case explains this in detail and gives two ready-to-use examples to kickstart your first online remote study.
EXAMPLES
The first example shows how to do simple click tracking and log data into a dataset. It also shows how to check whether a participant can actually log data with DF.device.canLogData. The second example is structurally very similar to the first example and shows a simple study in which the user has to click as fast as possible and as accurately as possible on a circle in the midst of rectangles. The code in this example logs several aspects of the user interaction with the experimental canvas: the distance of the circle (target), the current mouse position, the number of distraction objects and the current sequence number.
Both examples are very simple: a single HTML file with a simple HTML structure and a script part that builds on P5js (JavaScript).
WHAT YOU NEED
Apart from a new project in Data Foundry, you need:
- an existing dataset that will host the web prototype file(s) --> HTML, images, scripts?
- this dataset needs "web access" activated in the configuration (under the second tab)
- an IoT dataset that we log our data into
- this dataset needs "HTTP API access" enabled ("generate API token" on first tab in configuration)
- one or more participants that are registered in the project
- optional: a diary dataset if you want to collect qualitative data in the prototype
HOW TO DO THIS USE CASE
Complete basic setup
Start with the basic setup (register or login, create a new project), then:
- Register or login
- Create a new project
- Add a new Existing dataset to the project
- Add a new IoT dataset to the project
Activate the IoT dataset
To be able to store data from Javascript in the index.html HTML page you need to activate this in the IoT dataset.
- Go to the IoT dataset and scroll down to the configuration tab
- Under HTTP request click on ‘Generate token’ to enable access
Create an index.html file
Open a code editor of your choice (Sublime, Atom, ...) and create an index.html file. You could probably assume, the name index.html does have special meaning. If a website address is called, for example https://data.id.tue.nl, the index.html file is automatically displayed first, which in this case is https://data.id.tue.nl/index.html. For you, your first index.html will become our home page, and thus the page for your remote study. For more info on creating such a page you can look into the following tutorial: https://www.youtube.com/watch?v=tdanDsM80Cs
For this use case, we use the code for the two examples that were described above (for the code, see below), you can also use this and edit the file to your needs in your code editor. For now, we copy paste the following index.html file that corresponds to example 1 into our code editor.
After configuring this, the participant should be able to - go to the participant view, then open the website, then start their experiment
Upload the index.html file
- In the dataset overview page of the Existing dataset, click "upload files"
- Select the index.html file to upload
- After the file is uploaded you can scroll down on the dataset page and click on ‘web access’
- Click on activate access
- To preview the file, copy paste the url into a new tab and your webpage will appear
Add participants to the study
Before you can start your remote study with participants, you need to setup participant profiles for them and invite them to Data Foundry.
- Click on "manage resources" on the right of your project page. Click "add participant" under the tab participants.
- Depending on your study you can add one or multiple participants at a single time. Choose one or multiple participants.
- Fill in the name of the participant and email address. You can add the gender and age, as well as extra public parameters.
- Save it
- You can send an invite link to the participant on the participant page
- When the participant receives the email they can accept or decline the study
- If the participant gives consent and agrees to participate in the study, the participant will be marked green in the "manage resources" screen
- If the participant declines, they will be marked red in the "manage resources" screen
From the participant point of view
- Open the link that is provided in the invitation email
- Accept consent on the participant landing page
- Click on the invitation for the experiment
- Perform experiment
Now the only thing you have to do is sit back, relax and wait until the participants are done with their experiments, while you check Data Foundry so now and then to see if everything goes smooth.
Download the data that is collected
- Go to the IoT dataset
- Download the entire dataset by clicking on the download button.
- Or use the data export tool to make a selection of the data that you want to export, or visualize it. For more info on the data export tool, click here.
Example 1: simple click tracking
This example is a single HTML file that you upload to the existing dataset as index.html. Apart from the normal HTML content, this file contains a Javascript part that takes care of both the prototype behavior and the logging, see <script> in the example code below.
The script part is written with P5.js, and follows the common Processing structure of setup() and draw(). In the setup, we create a canvas and in draw, we fill it frame-by-frame. When the user presses the mouse button, an event is logged. The logged information contains the current mouse position and the current frame count.
<!DOCTYPE html>
<html>
<head>
	<title>Testing the participant data access</title>
	<!-- P5js library is needed for this example -->
	<script src="/assets/javascripts/p5.min.js" type="text/javascript"></script>
	<!-- this connects to the Data Foundry and allows for logging data -->
	<script src="/api/v1/participation" type="text/javascript"></script>
	<!-- some styling to center the P5.js canvas -->
	<style type="text/css">
		body,html{height:100%}body{margin:0;display:flex;justify-content:center;align-items:center}
	</style>
</head>
<body>

	<!-- the HTML body is empty except for the script below -->

	<script type="text/javascript">

		function setup() {
			createCanvas(400, 400);
		}

		function draw() {
			// check whether we can log data -> grey background
			if(DF.device.canLogData) {
				background(180);
			}
			// otherwise --> black background
			else {
				background(0);
			}

			// fill color transparency is based on mouse speed
			fill(120, 255 - constrain(dist(mouseX, mouseY, pmouseX, pmouseY), 0, 255));
			// draw circle around mouse pointer
			ellipse(mouseX, mouseY, 30, 30);
		}

		function mousePressed() {
			// log data when mouse is pressed
			DF.device.logData({x: mouseX, y: mouseY, f: frameCount}, "click");
		}

	</script>
</body>
</html>
Example 2: simple remote experiment
This example is, again, a single HTML file that you upload to the existing dataset as index.html. Apart from the normal HTML content, this file contains a Javascript part that takes care of both the prototype behavior and the logging, see <script> in the example code below.
The script part is written with P5.js, and follows the common Processing structure of setup() and draw(). In the setup, we create a canvas and in draw, we fill it frame-by-frame.
This example shows a simple study in which the user has to click as fast as possible and as accurately as possible on the circle. The challenge is also finding it. When the user presses the mouse button, an event is logged. The logged information contains the distance of the circle (target), the current mouse position, the number of distraction objects and the current sequence number.
<!DOCTYPE html>
<html>
<head>
	<title>Remote study: click circle fast</title>
	<link rel="stylesheet" media="screen" href="/assets/stylesheets/main.css">
	<script src="/assets/javascripts/p5.min.js" type="text/javascript"></script>
	<!-- we can use additional libraries next to P5.js -->
	<script src="/assets/javascripts/materialize.min.js" type="text/javascript"></script>
	<!-- this connects to the Data Foundry and allows for logging data -->
	<script src="/api/v1/participation" type="text/javascript"></script>
	<!-- some styling to center the P5.js canvas -->
	<style type="text/css">
		body,html{height:100%}body{margin:0;display:flex;justify-content:center;align-items:center}
	</style>
</head>
<body>

	<!-- add some HTML to introduce the study -->

	<div class="container">
		<h3>Mini response and accuracy experiment</h3>
		<p>Click on the circle as fast as you can.</p>

		<!-- P5.js canvas will be inserted here -->
		<div id="canvas"></div>
	</div>


	<script type="text/javascript">

		var timeout = -1;
		var target = {
			x: 0, y: 0
		};
		var counter = 0;

		function setup() {
			var c = createCanvas(400, 400);
			c.parent("canvas");
		}

		function draw() {

			// check if we can log data already
			if(!DF.device.canLogData) {
				background(0);
				return;
			}

			// check if we have reached the timeout
			timeout--;
			if(timeout < 0) {
				timeout = 10 * frameRate();

				// if yes, new target, new trial, let's go
				background(180);
				fill(0, 0, 255);
				noStroke();

				// draw objects
				for(var i = 0; i < 30 + counter * 5; i++) {
					rect(random(10, width - 10), random(10, height - 10), 10, 10);
				}

				// draw target
				target = {x: random(10, width - 10), y: random(10, height - 10)};
				ellipse(target.x, target.y, 10, 10);
			}
		}

		function mousePressed() {
			// log data when mouse is pressed
			DF.device.logData({
				dist: round(dist(target.x, target.y, mouseX, mouseY)),
				x: target.x,
				y: target.y,
				objs: 30 + counter * 5,
				progress: counter++
			}, "click");

			// reset timeout, so a new cycle start in draw()
			timeout = -1;
		}

	</script>

</body>
</html>
Almost at the end of the script, you see the mousePressed function that logs the data from every attempt. How does this work? We are using the participant API in Data Foundry that allows us to access a participant and also log data with a participant's device. If there is no device associated to the participant (in a cluster) then this API will create a new device on the fly. Then the API will look up the IoT dataset in the current project and add one itme with the given data. That's it.
After running the study for a few times, you can browse to the IoT dataset in your project and check the data that was logged to it.
Example 3: store user profiles for other experiments
In this last example we extend the HTML file from before. Again, we you upload to the existing dataset as index.html.
What has changed in this example? We use the participant's access to an Entity dataset to store a user profile for the participant. For user profiles, we use Entity dataset because individual entries can be retrieved, updated and even deleted.
To work with this example, first add an Entity dataset to the project.
In this case, we first retrieve the profile for the participant with the getProfile function--without doing anything with it, just for demonstration. Once the participant clicks on the canvas, we first log the dist, position, objects and progress as before, and then we calculate the meanDistance and meanReactionTime (by means of summing up all individual values iteratively and dividing by the count of step). These two values are then stored into the participant's user profile with the setProfile function.
After running this example for a participant, open the Entity dataset in the project and check the table view; now it shows the meanDistance and meanReactionTime values for each participant.
<!DOCTYPE html>
<html>
<head>
    <title>Remote study: click circle fast 2</title>
    <link rel="stylesheet" media="screen" href="/assets/stylesheets/main.css">
    <script src="/assets/javascripts/p5.min.js" type="text/javascript"></script>
    <!-- we can use additional libraries next to P5.js -->
    <script src="/assets/javascripts/materialize.min.js" type="text/javascript"></script>
    <!-- this connects to the Data Foundry and allows for logging data -->
    <script src="/api/v1/participation" type="text/javascript"></script>
    <!-- some styling to center the P5.js canvas -->
    <style type="text/css">
        body,html{height:100%}body{margin:0;display:flex;justify-content:center;align-items:center}
    </style>
</head>
<body>

    <!-- add some HTML to introduce the study -->

    <div class="container">
        <h3>Mini response and accuracy experiment</h3>
        <p>Click on the circle as fast as you can.</p>

        <!-- P5.js canvas will be inserted here -->
        <div id="canvas"></div>
    </div>


    <script type="text/javascript">

        var timeout = -1;
        var target = {
            x: 0, y: 0
        };
        var counter = 0;
        var sumDistance = 0;
        var sumReactionTime = 0;

        function setup() {
            var c = createCanvas(400, 400);
            c.parent("canvas");

            // get user profile
            DF.participant.getProfile(function(data) {
                // use this callback to store the profile data locally
            });
        }

        function draw() {

            // check if we can log data already
            if(!DF.device.canLogData) {
                background(0);
                return;
            }

            // check if we have reached the timeout
            timeout--;
            if(timeout < 0) {
                timeout = 10 * frameRate();

                // if yes, new target, new trial, let's go
                background(180);
                fill(0, 0, 255);
                noStroke();

                // draw objects
                for(var i = 0; i < 30 + counter * 5; i++) {
                    rect(random(10, width - 10), random(10, height - 10), 10, 10);
                }

                // draw target
                target = {x: random(10, width - 10), y: random(10, height - 10)};
                ellipse(target.x, target.y, 10, 10);
            }
        }

        function mousePressed() {
            // log data when mouse is pressed
            DF.device.logData({
                dist: round(dist(target.x, target.y, mouseX, mouseY)),
                x: target.x,
                y: target.y,
                objs: 30 + counter * 5,
                progress: counter++
            }, "click");

            // calculate the sum (for calculating the mean later)
            sumDistance += round(dist(target.x, target.y, mouseX, mouseY));
            sumReactionTime += round(10 * frameRate() - timeout);

            // update user profile with the mean distance and reaction time
            DF.participant.setProfile({
                meanDistance: round(sumDistance/counter),
                meanReactionTime: round(sumReactionTime/counter)
            });

            // reset timeout, so a new cycle start in draw()
            timeout = -1;
        }

    </script>

</body>
</html>
After completing these three examples, think about how you could use the user profile feature in a creative way? Perhaps allow the participant to resume the study even after closing the browser window, or by using the user profile as a form of "highscore table". Check out the two exercises below for more fun.
Exercises
Why not try and see if you got it?
Exercise 1: Can you add the elapsed time from showing a new scene with randomly objects and the moment when the user clicks on the circle? This might be very useful in assessing their speed or reaction time. Speaking of reaction time, can you also think of a way to measure the reaction time?
Exercise 2: Can you let participants finish the study after either 10 successful interactions (distance below a certain threshold) or after 3 unsuccessful interactions? Try to provide them with information on next steps or lead them back to the participant landing page.