Use-case: Object ethnography
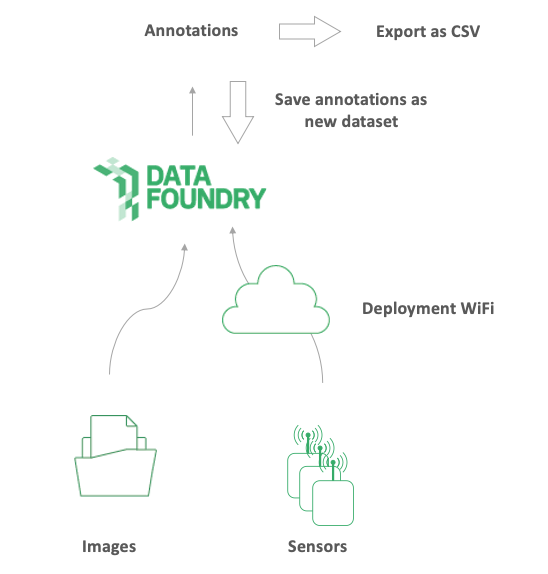
Initial collection of photos and sensor data, then annotation with Data Foundry tools, export as CSV for visualization.
CONTEXT
Object Ethnography is describes a process of the observation of objects by means of quantitative and qualitative research methods, e.g, logging sensor data and capturing annotations by researchers and participants on observations. For conducting such a study, one or more prototypes that collect sensor data and potentially photo data are deployed in the environment of the participant. The participants are registered in a project and have each one or more devices that collect such data. To have a coherent overview, these participants and their device(s) are placed into a cluster. The devices log sensor data to an IoT dataset. In the meanwhile, the prototype also collects photos and stores them locally. After conducting the study, the photos can be uploaded to a Media dataset. Either the researcher or the participant herself can annotate the sensor data and the photos, resulting in an qualitative dataset from the researcher with their findings and observations. Participants can also be involved in this process by letting them fill in a diary with their thoughts and observations.
EXAMPLE
An example of Object Ethnography is the Peekaboo project by Yu-Ting Cheng [1]. The Peekaboo is an observational camera for home ecologies concerning privacy. The design enables inhabitants to control their data release actively or passively. The Peekaboo cam is an observational research camera with a coverable lens. The resulting photo streams provide qualitative insights on how things in the everyday home transition and move. Next to that, objects also senses data (quantitative data). Afterwards, Yu-Ting was able to annotate both on the sensor data and on the media files. Participants were also involved, in the sense that they contributed with on the annotation process as well from their side.
WHAT YOU NEED
- A prototype with one or multiple sensors and a camera module, that is connected to the deployment internet.
- A project created in Data Foundry, including a
- An IoT dataset
- A Media dataset
- Diary dataset → copy token link to invite.
- Participants
- Option using OOCSI
- OOCSI connection implemented in the Java or Arduino code of your IoT prototype
HOW TO USE THIS
Complete basic setup
The basic setup is as follows:
- Register or login
- Create a new project
- Add a new IoT dataset to the project
- Add a Diary dataset to the project
- Add a Media dataset to the project
- Add a new device for every prototype
- Add your participants
- Place participants and corresponding devices in a cluster
Collect and log sensor data
The first dataset that you have created is an IoT dataset that allows to collect and store all kinds of sensor data. We assume that your prototype is already connected to the OOCSI network, and that you can send interesting data to a channel on the OOCSI network. Connections to OOCSI are available for a several platforms and technologies. A list with possible options is provided under the tab OOCSI API.
Connect to the OOCSI API by setting up channel name: go to the second tab in the configuration screen. To create a channel, you need to provide the channel name. Enter a unique channel name and click on "save". Copy paste the example code into your existing ESP/Arduino code and start sending data items to the dataset.
You can also do this with other platforms. Simply click on the example code of each different platform. Here is the example used for Arduino/ESP. Change the following things in the example code to your own preferences. Based upon Arduino/ESP, these include:
	oocsi.connect(...);
	// Replace CHANNEL by the channel that you provided above
	oocsi.newMessage("CHANNEL");
	// Copy paste your device id (head over to manage resources devices → and copy paste it into ‘DEVICE’)
	oocsi.addString("device_id", "DEVICE");
	// Optional activity marker
	oocsi.addString("activity", "EVENT or ACTIVITY");
	// Here you can provide actual data to be stored in the dataset
	oocsi.addFloat("airquality", 0.67);
	oocsi.addBool("doorclosed", false);
	// Send the data
	oocsi.sendMessage();
Repeat this step for every prototype that collects data in this use-case.
If all participants have given their consent for the study through the invitation email, the devices in the resources screen will turn green and be active.
Setup a Diary dataset
Open the empty dataset you just created Fill in the template text box with a short description on what participants should write about. Send the diary with the link provided to your participants
Add files to your media dataset
In the empty media dataset you created, go to upload files and select the files that you want to upload. Max MB per upload is 30MB. Select the name of the participant that corresponds to this dataset and add a short description to the collection of images. Do not upload files that contain private data (personal information, medical data, financial data and passwords, amongst many other sensitive data). Only upload and share data here if you have the right to do so. If in doubt, please check with support. You can provide a description on each single media file by clicking on the little green icon on the right of each media file in the list view. For this use case it is prefered to annotate using the Data Tool.
Data Tool: Annotate IoT and Media dataset
Go to the Data Tool and select the IoT and Media dataset of this project , and the columns of that dataset that you want to visualize, or export. Ensure that you have selected the "ts" column in all datasets that you want to visualise or export. Click on proceed to continue.
As a first step, select the "ts" attribute for the x-axis. You can choose a sensor data attribute for the y-axis, so you can directly see the sensor data over time. You have the options to filter the data or annotate on it. Annotation might be helpful to discover new relations between your IoT dataset and Media dataset. Click here for more information on how to annotate on a media dataset. Change the color to your own preference Use sampling where needed.
Data Tool: Export all data
At this stage, you can export both the data and also the visualisation. For the dataset, click the "download" button and wait for a CSV download to start. The visualisation can be exported by clicking the small "..." button next to the visualisation. There are several options to choose, depending on your next steps.
REFERENCES
[1] Cheng, Y-T., Funk, M., Tsai, W-C., & Chen, L-L. (2019). Peekaboo cam: designing an observational camera for home ecologies concerning privacy. In DIS 2019 - Proceedings of the 2019 ACM Designing Interactive Systems Conference (pp. 823-836). New York: Association for Computing Machinery, Inc. https://doi.org/10.1145/3322276.3323699