Use-case: Data-enabled design I (contextual step)
Logging sensor data and prompting end-users for qualitative data depending on input from multiple sensors.
CONTEXT
Data Enabled Design focuses on the use of data as a creative material in the design process, wherein the power of data is emphasized, in order to evaluate and validate design decisions. In the Data Enabled Design course (Master course at ID TU/e), students are asked to create prototypes that remotely sense and record contextual data, and that possibly adapt while being situated in an everyday context. During the course, the data enabled design kit is provided to the students which helps them to run these remote data-enabled design explorations.
This approach encourages the students to combine quantitative and qualitative data gathering by means of logging sensor data, annotating on this, and providing extra qualitative research tools during the deployment such as questionnaires and forms to discover personal and behavioural stories. When issues might occur during the deployment, you have a clear, real-time overview in Data Foundry.
A possible extension in the contextual phase it to use the Data Foundry Telegram bot to communicate with participants in the context and ask them to either qualitative information in the form of diary entries and photos. More on this extension can be found in the Telegram use-case.
Don't forget to check out the second part of the Data-enabled Design use-case.
EXAMPLE
An example of this might be a deployment wherein three sensors are logging values. The effects can immediately be seen in the dataset. Next to that, we can use the Telegram bot as a direct channel between the researcher and the participants, and we can prompt them for diary entries or contextual pictures to be taken during the deployment. Finally, all resulting data can be visualized using the data export tool, and even extended through annotations by the researchers on the dataset itself.
WHAT YOU NEED
- A prototype with one or multiple sensors, that is connected to the deployment internet, e.g., an IoT prototype with an Arduino/ESP (connected to a private or public Wi-Fi from the users) Option using a prototype with a camera that takes or request photos in context.
- A project created in Data Foundry, including:
- an IoT dataset
- a diary dataset (optional, for use with Telegram bot)
- a media dataset (optional, for use with Telegram bot)
- Registered participants
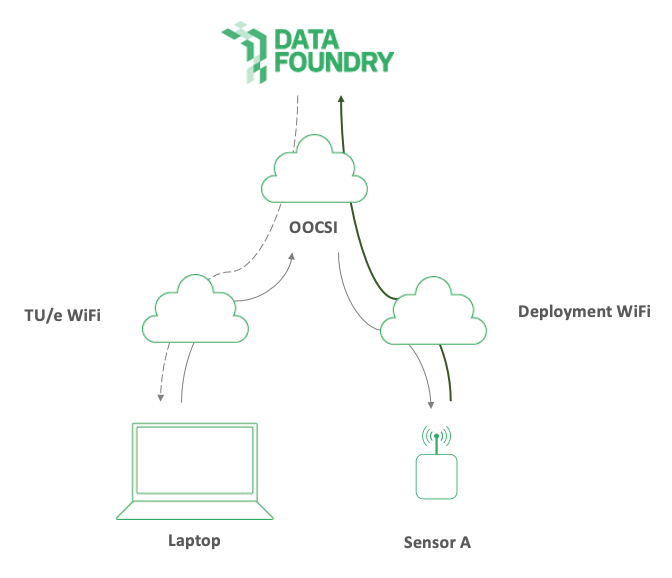
- OOCSI connection implemented in the Java/Arduino code of your IoT prototype (see code example below)
HOW TO USE THIS
Complete basic setup
Follow the links in the bullet list to complete the basic setup
- Register or login
- Create a new project
- Add a new IoT dataset to the project
- Add a new device for every prototype
- Add participants depending on the device deployment plans
- Optional: Add a media dataset to the project
- Optional: Connect to Telegram bot and also invite your participants to Telegram
Collect and log contextual sensor data
Use the OOCSI network to add data items to the IoT dataset that you have created earlier. This is option is available from a wide variety of platforms and technologies. A list with possible options and example code is provided on the dataset page under the tab OOCSI API.
- Connect to the OOCSI API by setting up a channel name: use the second tab in the configuration screen
- To create a channel, enter a unique channel name and click on save
- Copy paste the example code into your existing ESP/Arduino code and add data item in the dataset. You can also do this with other platforms. Simply click on the example code of each different platform. Below is an example for Arduino/ESP.
Change the following things in the example code to your own preferences. Based upon Arduino/ESP, these include:
# connect to the OOCSI network using your own Wifi credentials and the server name 'oocsi.id.tue.nl'
oocsi.connect(...);
# Replace CHANNEL by the channel that you provided in the dataset configoration
oocsi.newMessage("CHANNEL");
# Copy paste your device id (head over to manage resources devices → and copy paste it into ‘DEVICE’);
# a device ID look like this: d0234858235498234837
oocsi.addString("device_id", "DEVICE");
# Optional activity marker, for instance, 'eating', 'sleeping', or 'cleaning'
oocsi.addString("activity", "EVENT or ACTIVITY");
# From here you can provide actual data to be stored in the dataset (as many as you like)
oocsi.addFloat("airquality", 0.67);
oocsi.addBool("doorclosed", false);
# Send the data
oocsi.sendMessage();
- Repeat the previous step for every device that is part of your deployment.
- Ensure that devices are linked to participants (see 'manage resources' in your project)
- If all participants have given their consent for the study through the invitation email, the participants in the resources screen will turn green and be active.
Apart from sensor data, we might be interested in contextual data that is subjective, qualitative and perhaps as rich as photos and images.
Add files to a media dataset
In the empty media dataset that you have created optionally, you can upload files directly with up to 30MB per file. When you upload files, you need to provide the name of the participant that corresponds to this dataset and add a short description to the collection of images. Please be careful not to upload files that contain private data (personal information, medical data, financial data and passwords, amongst many other sensitive data). Only upload and share data on Data Foundry if you have the right to do so. If in doubt, check with staff or support. After uploading, you can annotate a media file by clicking on the little green icon on the right of each media file in the list view.
If you use the Data Foundry Telegram bot, and your study participants are connected to the bot, then the participants can upload media directly from the Telegram app. You can even prompt them to do so by sending them a short message from Telegram and then wait for photos or images to come in. You can annotate them or ask your participants to annotate media themselves (from the participant landing page).
Add entries to a diary dataset
Similar to media, photos and images, participants can add entries to a diary dataset. This is possible from the participant landing page (for participants) or from the partipant page for you as the researcher. The latter makes sense if you do a mini interview and want to record a few points as diary entries. Again, you need to provide the name of the participant that corresponds to this dataset.
If you use the Data Foundry Telegram bot, and your study participants are connected to the bot, then the participants can submit diary entries directly by chatting with the Telegram bot. You can even prompt them to do so by sending them a short message from Telegram and then wait for entries to come in.
Export data with the Data Tool (or Annotate)
Go to the Data Tool and select the IoT, diary and media datasets of this project. All columns of the individual datasets will be auto-selected. You can deselect columns to reduce the exported data. Click on proceed to continue.
On the next screen, fill in the x and y-axes using the dropdown menus. Usually, it makes a lot of sense to use the timestamp ("ts") on the x-axis. You have the options to filter the data or annotate on it. Annotations might be helpful to discover new relations between your IoT dataset and Media dataset. Use sampling if the dataset is too large. Finally, you can export the dataset (as a CSV file) or save the visualization as an image by clicking on button with 3 dots.
For more information on the data export tool, click here.